In probability theory and statistics, the Laplace Distribution is a continuous probability distribution which is the distribution of differences between two independent variates with identical exponential distributions.
The Laplace Distribution app provides for the data entry of one variable: a Random Variable (x). Data Entry is accomplished via a numeric data entry text field.
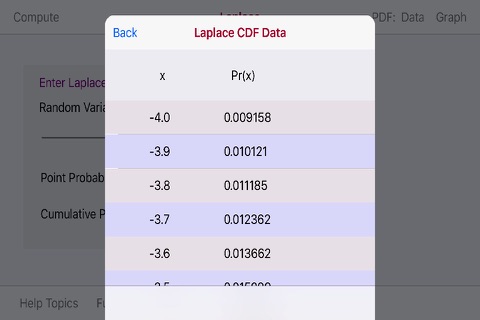
The Laplace Distribution app produces a PDF/CDF Graph and PDF/CDF Data Tables The Random Variable (x) selected is used to compute the PDF/CDF data.
The PDF and CDF graphs are touch interactive graphs for computed (x/Pr(x) paired values. The graphs hav a touch feature whereby upon the touch a slidable vertical line appears. Upon movement of the line a paired (x,Pr(x) values appear relative to the line position on the graph curve.
The horizontal x-axis displays computed (x) values. The vertical y-axis plots a range of Pr(X) values.
The Laplace Apple Watch Extension provides for a key entry of the Random Variable (x) with a range of -4.0 to 4.0 and displays the Point and Cumulative Probabilities


